Introduction
A number of large observational studies of HD progression have been conducted over the past two decades (Biglan et al. 2016, Dorsey et al. 2013, Orth et al. 2011, Paulsen et al. 2014, Tabrizi et al. 2013). The largest of these studies, Enroll-HD (Landwehrmeyer et al. 2017), is ongoing and provides openly accessible datasets for investigators. The primary purpose of these observational studies is to provide a better understanding of the measurable natural history of HD, which is needed to inform clinical trial design of candidate therapeutics that aim to slow disease progression. Here we outline some key considerations regarding observational HD data and its analysis that are especially pertinent to clinical trial design.
The natural history of HD progression and the design of clinical trials
A central goal of clinical trial design is to maximize the chance of showing convincing treatment efficacy as efficiently as possible, minimizing exposure to any potential harm from an unproven therapeutic, as well as the timelines to submission for approval of an effective treatment or to abandonment of an ineffective one. It also minimizes the financial and opportunity costs of evaluating a candidate therapeutic, a central consideration when industry decides where and how to invest resources.
Efficacy is defined as a meaningful improvement over time in the rate of disease progression or the rate of disease-related events compared to a control group (often a placebo group) whose experience represents disease progression when all potential influences other than the treatment are identical. The control group’s experience will represent a combination of natural disease progression—usually within the context of the current standard of treatment—and possible modifiers (e.g. placebo effects) due to participating in the trial. It is usually anticipated that natural history will be the dominant influence in the control group, underscoring the relevance and importance of observational studies from which these disease effects can be measured and then predicted for a future clinical trial.
Key aspects of HD change estimated from observational studies
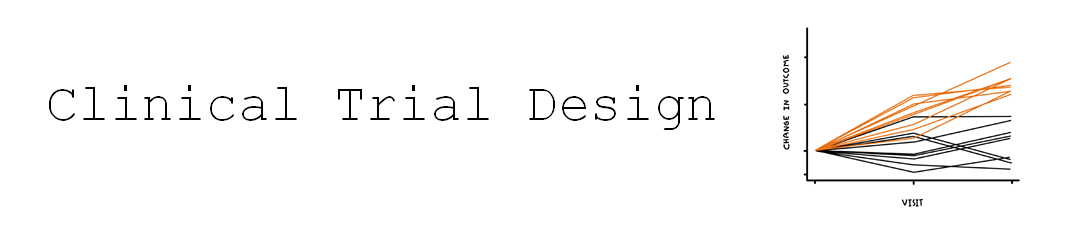
Our focus is on the rate of change or frequency of occurrence of consequential HD phenomena. Roughly speaking, the more something changes within time ‘X’ without the therapeutic, the easier it is to tell whether the therapeutic is having an effect. If a process changes very slowly over time or is very rare, then regardless of how central it may be to HD it will not be a practical measurement to use as the basis of a clinical trial.
The rate of change of an outcome is not the only measurement property of importance. Measures that change rapidly on average but also fluctuate wildly with repeated measurements in the same individual may be less useful than other measures that change more slowly but steadily. This consistency of predictable change is of central importance in determining how large a study needs to be to confidently detect an HD treatment effect (Diggle et al. 2002, Schobel et al. 2017). The term ‘signal-to-noise ratio’ is appropriate when referring to this balance between the predicted average rate of change (signal) and unpredictable fluctuation (noise). We will discuss this crucial concept in more detail below.
The inter-relationship among the progression of individual measures is also of much interest. Enroll-HD and similar databases provide an especially rich source of data to investigate these relationships. A wide variety of measures are available related to motor, cognitive, and psychiatric aspects of the disease, as well as summary measures of day-to-day functioning. Demographic variables such as education level, which have potentially confounding effects on apparent disease relationships, are also available.
For clinical trial design, the inter-relationships of other measures to those that summarize daily functioning, such as the UHDRS Total Functional Capacity (TFC) scale, are especially important. Regulators must be convinced that a patient’s life is meaningfully better if a treatment improves the primary trial outcome. However, outcomes that directly measure “better”, such as the TFC, may not be the measures that change most rapidly and predictably. If there are other measures or combinations of measures for which change is more readily detectable, an additional requirement is that those measures must at least have a strong empirical relationship to measures such as the TFC that have inherent clinical meaning. When a strong empirical relationship exists, we must eventually show evidence that this link between measures is causal and not merely a correlation (Temple 1999, Burzykowski et al., 2005, U.S Food and Drug Administration 2018). Will improvement in the alternative measure necessarily translate to clinically meaningful improvement?
Observational studies allow us to assess the empirical relationships among measures, and it is tempting to impute notions of cause and effect. However, we must caution that the question of causality is difficult to answer without direct experimental evidence (e.g., biological investigation or data from previous clinical trials). Observational data analysts should be aware that various statistical techniques exist that attempt to address causality within observational data, and these can be helpful in refining which empirical relationships are plausibly causal. However, these techniques also require that we accept various strong (and often untestable) assumptions about the nature of the data. Reliance on such assumptions may prove unacceptable in a regulatory context.
Prognostic measures and the prediction of change
All other things being equal, treatment effects are more readily detected with fewer participants and over shorter time among those who show the most rapid and consistent change in the outcome measure (Langbehn and Hersch 2020). Similarly, if the outcome is a distinct event such as the loss of ability to live independently, a treatment effect is most easily detected among those who have the highest probability of experiencing the event within the duration of a clinical trial. Observational datasets such as Enroll-HD not only allow study of HD change over time, but also to investigate baseline characteristics that help predict future change (prognosis). In future trials, such baseline measures might be used as part of the participant-screening criteria so that the trial is “enriched” for those whose disease will progress most rapidly.
We must, however, never uncritically assume that all other things are indeed equal. The potential advantage of trial enrichment is often calculated under the assumption that treatment response is unrelated to the aggressiveness of prognosis. That may well not be true, and it may often be more realistic to consider a range of possible relationships between prognosis and treatment response. To take this a step further, in some instances we may decide that baseline prognostic data should be used to define an appropriate therapeutic window for the proposed therapy, with screening exclusion of those for whom disease changes are likely to be too aggressive, as well as for those in whom it will be too slow.
Even if screening enrichment is not used, for many trial designs the power to detect a treatment effect can be notably increased by statistical control of prognostic baseline characteristics in the analysis of the final trial data (such statistical control must be a prespecified feature of the definitive clinical trial analysis.) Baseline characteristics may explain (predict) some of the “noise” in the outcome data, effectively increasing the signal-to-noise ratio relevant for testing the treatment effect (Julious 2010). The potential advantage of such statistical control can be estimated from observational longitudinal data, for example, by investigating reduction of apparently random variation in an outcome when a prognostic factor is used as a covariate in a longitudinal model of untreated progression.
Modelling an appropriate subset of observational data
For observational data to inform clinical trial design, the relevant subset of participants must be chosen for analysis. This relevance principal is obvious in some respects: If we are to model a trial targeting the early stages of diagnosed HD, then we want to limit our observational analyses to participants in that early disease stage. However, there are more subtle aspects of the relevance that are sometimes overlooked. For example, Enroll-HD contains longitudinal follow-up data for some participants for much longer than a realistic clinical trial duration. Using their baseline data, such participants may be appropriate to include in a trial model. However, after many years these participants will have often progressed past the relevant stage of disease. So we may want to limit the longitudinal data being analyzed to only the first few years of follow-up (Langbehn and Hersch 2020). (Similarly, participants with long follow-up may have evolved to the targeted study group, even when they would have been excluded with screening of only their baseline data. A series of later observations from such participants might be a valid contribution to the data being analyzed.)
A (tiny bit of) math.
We can sharpen our appreciation of the relevance of observational data to clinical trial design if we briefly turn our attention to a key mathematical formula that describes the approximate relationships among sample size, follow-up time, treatment effect, and the untreated rate of an outcome progression measure. The goal is an appreciation that sample size varies as the squared value of important measurement characteristics—two of which can be estimated from observational study data.
Earlier, we appealed to an intuitive understanding of the term signal-to-noise ratio. We now define more precisely what we mean by the term. We refer here to change per year, but the definition can be applied to any appropriate unit of follow-up time.
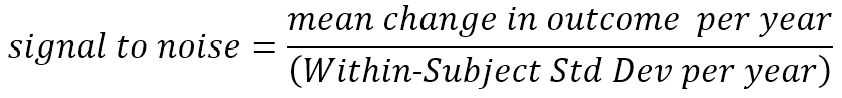
The signal we wish to detect (and hope to change with a therapeutic) is the mean amount of (true) change occurring over time. The noise, in the denominator, reflects the unpredictable deviation around each participant’s mean rate of change; this noise is sometimes referred to as measurement error, but that term can be misleading (in this context, the noise also includes real short-term deviations from the longer term mean trend, e.g., an HDGEC’s motor signs vary somewhat from day to day around their short-term mean; variation in recorded UHDRS motor scores that perfectly reflect this real variation around the average motor score increase nonetheless count as noise for our purposes.) In the absence of substantial previous clinical trial data, this signal-to-noise ratio is estimated from longitudinal observational data obtained in studies such as Enroll-HD. (It is most commonly calculated using the fixed effect and variance component estimates from a mixed-effect longitudinal model of such data).
The factor by which a treatment changes the mean rate of decline is reflected in the treatment effect size.

For example, if a treatment group experienced a mean TFC decline of 0.6 points per year and the control group’s mean decline was 1.2 points per year, then the treatment effect would be 0.6/1.2 = 0.5. The translation of treatment effect to effect size conveys the magnitude of treatment effect in units of within-participant standard deviations. This is the unit of measurement that determines sample size for a clinical trial. In the above example, further assume that the year-to-year standard deviation of TFC change within individuals is 0.8 points per year. The (untreated) signal-to-noise ratio is then 1.2/0.8 = 1.5. The treatment effect size is 0.5 * 1.5 = 0.75.
Consider a two-armed randomized trial comparing the effect of treatment versus placebo. The trial result is treatment-induced change in the progression rate of the outcome measure. The approximate sample size formula has the following form:

The function F(.) in the denominator provides a value that increases roughly with the number and spacing of follow-up visits at which the outcome is evaluated and—more crucially— with the square of the total length of follow-up (Diggle et al. 2002). (F(.) is the sum of squares of mean-adjusted visit times.) This formula is approximate but illustrates relationships that remain fundamental in more detailed calculations that better reflect realistic trial details (Julious 2010) (e.g., placebo-effects, drop-out rates, multiple trial arms, and designs adaptive to interim analysis.). Follow-up length and frequency are defined by the trial designers. The clinically-meaningful treatment effect one hopes to detect is a matter of (hopefully well-reasoned) conjecture. This leaves the outcome measure’s signal-to-noise ratio as the critical quantity to be estimated from historical data. The data collected in longitudinal, prospectively-designed observational studies will often be the data best suited for deriving these estimates.
Our ever-increasing cache of such data, collected from studies such as Enroll-HD, makes HD one of the most thoroughly documented brain diseases. Eventually, prospective experience in HD trials will allow estimation of important secondary parameters such as placebo effects and bias induced by rater expectations. Most of those trials have yet to be designed, and those designs will depend crucially on existing observational data such as those discussed here.
References
Biglan KM, Shoulson I, Kieburtz K, et al. Clinical-Genetic Associations in the Prospective Huntington at Risk Observational Study (PHAROS): Implications for Clinical Trials. JAMA Neurol 2016;73(1):102-110.
Burzykowski T, Molenberghs G, Buyse M. The Evaluation of Surrogate Endpoints. Springer, New York. 2005.
Diggle P, Heagerty P, Lian K, Zeger S Analysis of Longitudinal Data, second edition. Oxford University Press. Oxford UK. 2002
Dorsey ER, Beck CA, Darwin K, Nichols P, Brocht AF, Biglan KM, Shoulson I; Huntington Study Group COHORT Investigators. Natural history of Huntington disease. JAMA Neurol. 2013 Dec;70(12):1520-30. doi: 10.1001/jamaneurol.2013.4408.
Julious SA. Sample Sizes for Clinical Trials. CRC Press. Boca Raton, Florida. 2010.
Landwehrmeyer GB, Fitzer-Attas CJ, Giuliano JD, Gonçalves N, Anderson KE, Cardoso F, Ferreira JJ, Mestre TA, Stout JC, Sampaio C. Data Analytics from Enroll-HD, a Global Clinical Research Platform for Huntington’s Disease. Mov Disord Clin Pract. 2016 Jun 22;4(2):212-224. doi: 10.1002/mdc3.12388. eCollection 2017 Mar-Apr.