PDS Documentation Hub
1 Overview
1.1 Dataset
Extraction
The data contained in Enroll-HD PDS6 was extracted from the Enroll-HD electronic data capture (EDC) database on November 4, 2022, at 10:00 UTC.
Data sources
The PDS6 dataset encompasses data exclusively from Enroll-HD participants, collected from several sources. These sources are the Enroll-HD study, the REGISTRY study, and clinical data collected in adhoc visits outside of the aforementioned studies.
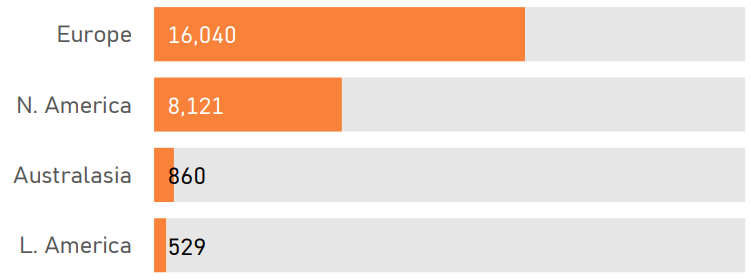
Enroll-HD is an observational cohort study and global clinical research platform designed to facilitate Huntington’s disease (HD) clinical research. It includes participants from North America, Europe, Australasia, and Latin America. The study started in 2012 and is still active and actively recruiting.
REGISTRY is an observational cohort study of HD conducted in Europe. The study started in 2004 and concluded in 2015. As Enroll-HD began, REGISTRY sites and participants began to transition into Enroll-HD. Enroll-HD dataset releases include individuals who initially participated in REGISTRY then consequently enrolled in Enroll-HD and consented to the migration of their REGISTRY data into the Enroll-HD dataset. Registry data are available for a subset of Enroll-HD participants.
Clinical data from additional sources (Ad Hoc data) are available for a subset of Enroll-HD participants. These data were collected at routine clinical visits outside of the Enroll-HD and REGISTRY studies, and comprise HD assessment data (e.g., UHDRS Motor). The date of collection of these data typically pre-date a participant’s enrollment into REGISTRY or Enroll-HD.
Study specific protocols, annotated eCRFs, and data collection guidelines are housed on the Documentation page of the Enroll-HD website.
Participant inclusion
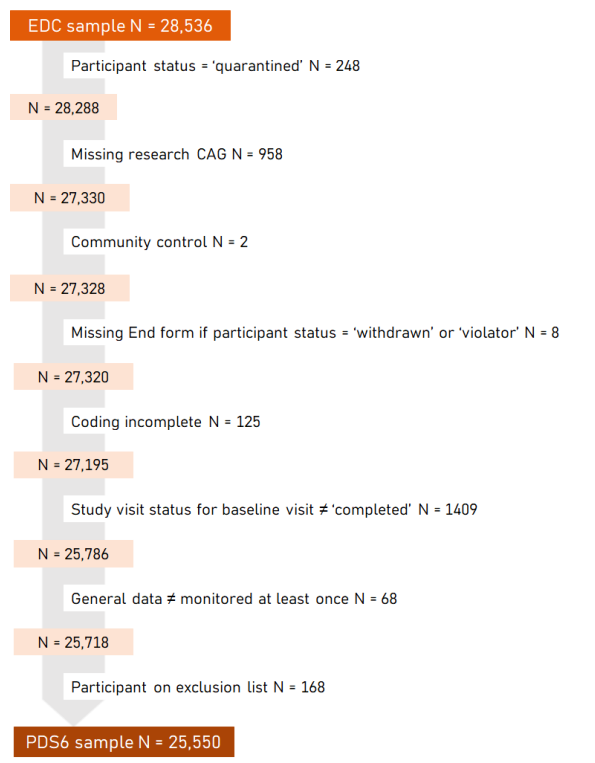
To be included in the PDS6 release, participant’s data had to meet several requirements. Figure 1.1 illustrates the number of participants whose data met each of the predefined inclusion requirement and illustrates how the final sample size of PDS6 was determined.

Due to data exclusion requirements, not all participants enrolled in Enroll-HD at the time of PDS6 data cut are included in PDS6. Similarly, not all participants included in PDS5 are included in PDS6. Data from 200 participants who were included in PDS5 were not included in the current PDS release. Enroll-HD is an active, longitudinal study. A participant eligible for inclusion for one release may be ineligible the next (e.g., participant data quarantined). Data for PDS5 participants not included in PDS6 may be available through specified dataset (SPS) request.
1.2 Sample Size
PDS6 contains data on 25,550 Enroll-HD participants. Sample size by PDS release is presented in Figure 1.2 .

1.3 Visits
PDS6 contains data from 95,038 visits (baseline and follow-up visits only; all sources). Of these, 78,728 were Enroll-HD visits. The remainder are from Registry (N = 15,292) and ‘Ad Hoc’ sources (N = 1,018). A breakdown of visits by data source is provided in Table 1.1. Number of Enroll-HD visits only by PDS release are illustrated in Figure 1.3.
| Data source | Participants | Visits |
|---|---|---|
| Enroll-HD | 25550 | 78728 |
| Registry 3 | 4337 | 10114 |
| Registry 2 | 2153 | 5178 |
| Ad Hoc | 316 | 1018 |
| Total | 95038 |

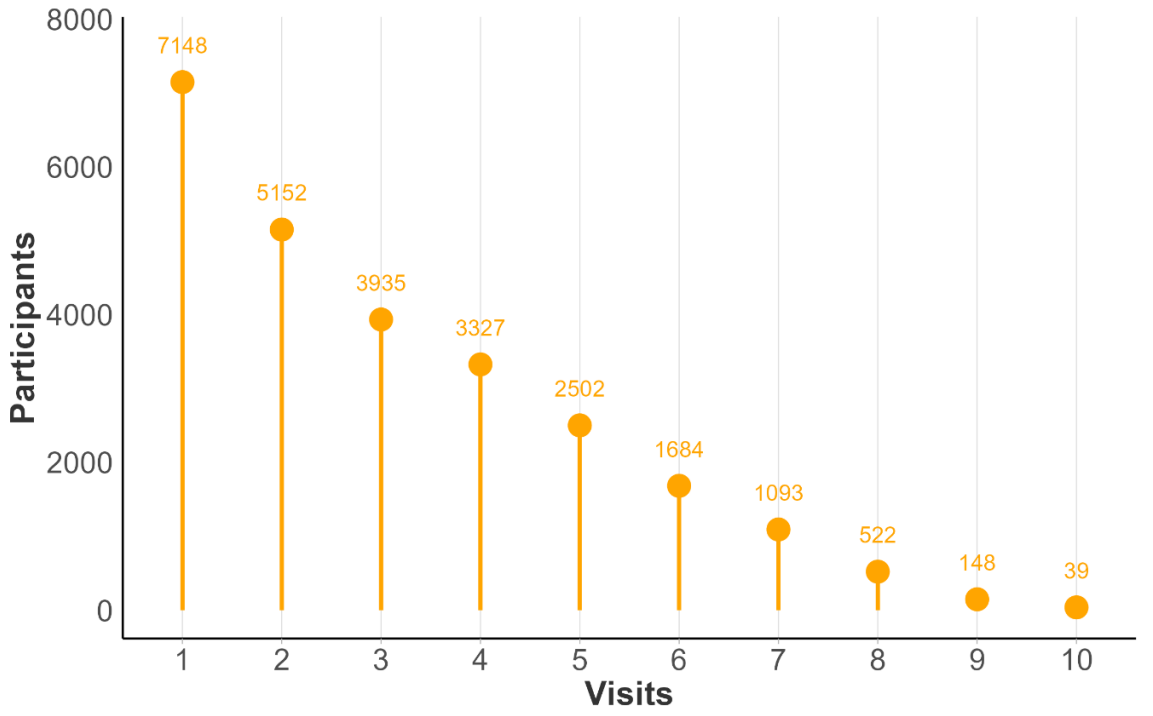
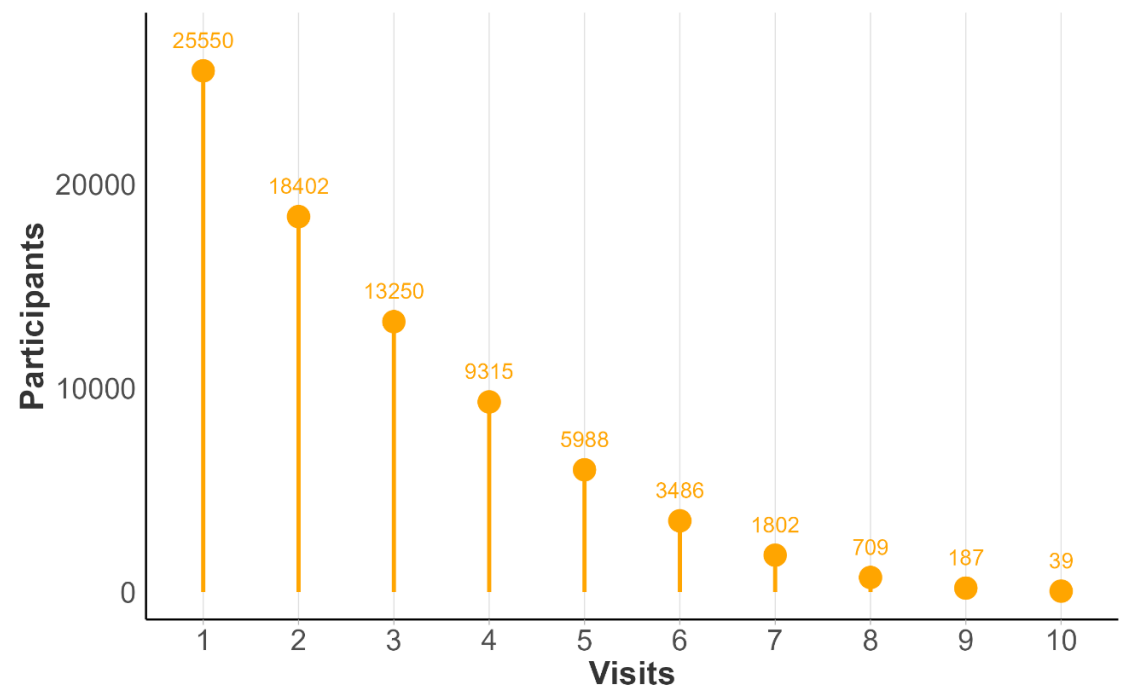
Considering baseline and follow-up visits from Enroll-HD only, total number of visits per participant in PDS6 ranges from 1 to 10. In Figure 1.4 , we illustrate participant counts by maximum number of Enroll-HD visits. Each participant is represented once, included in the bar indicative of their maximum number of visits. In Figure 1.5, we illustrate maximum participant counts for a specific number of visits. This plot is cumulative, the goal being to illustrate largest available sample size for a specific number of visits. For example, the participant with 10 visits is represented in visit bars 1 through 10, the participants with 9 visits are represented in visit bars 1 through 9, and so on.
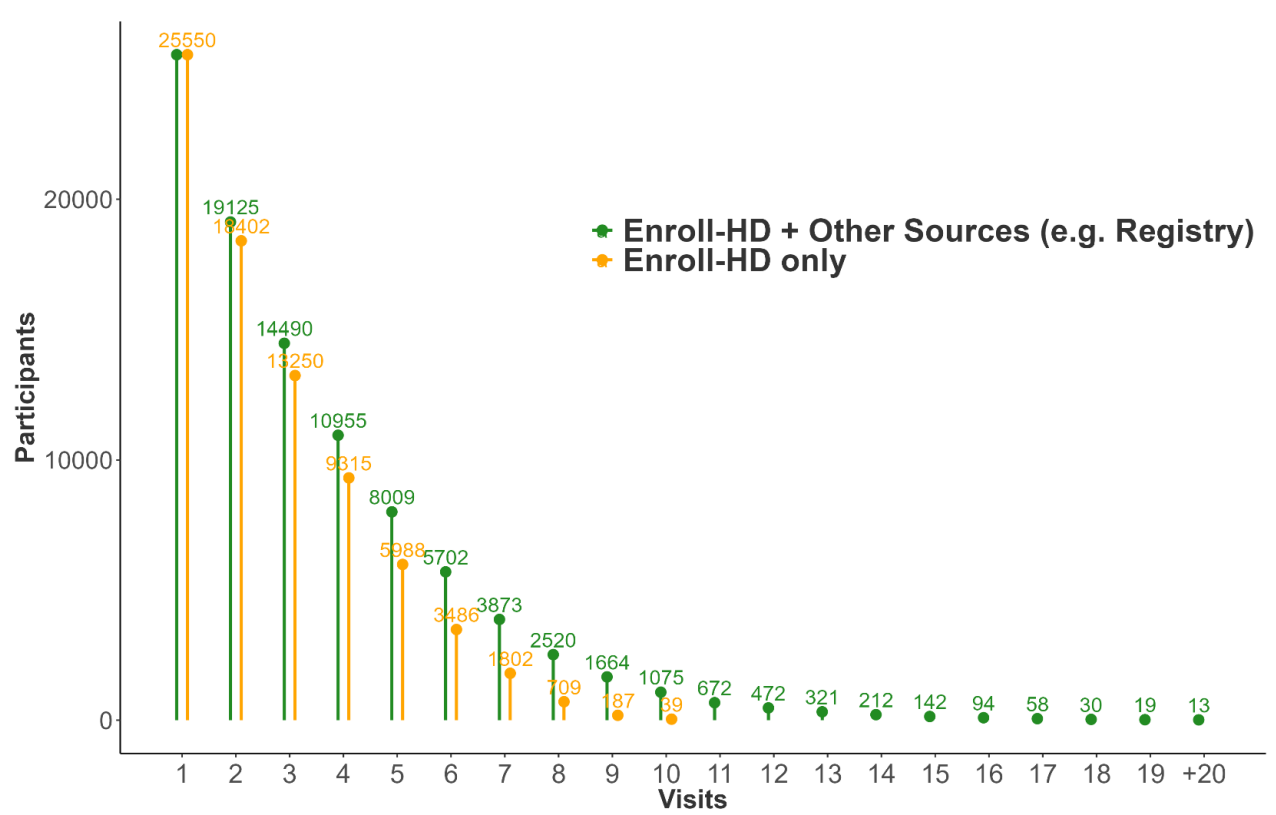
Considering baseline and follow-up visits from all data sources (Enroll-HD, REGISTRY, Ad Hoc visits), total number of visits per participant ranges from 1 to >20. Maximum participant counts by visit number are presented in Figure 1.6.
1.4 Sample Characteristics
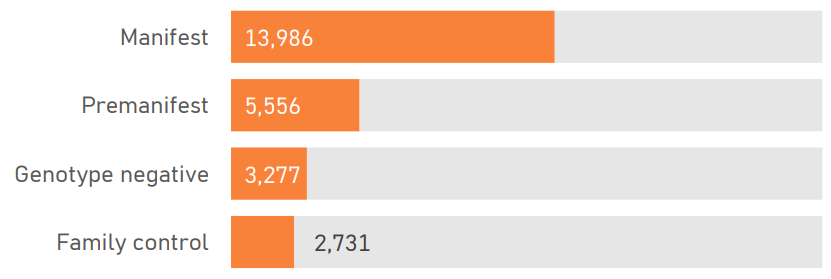
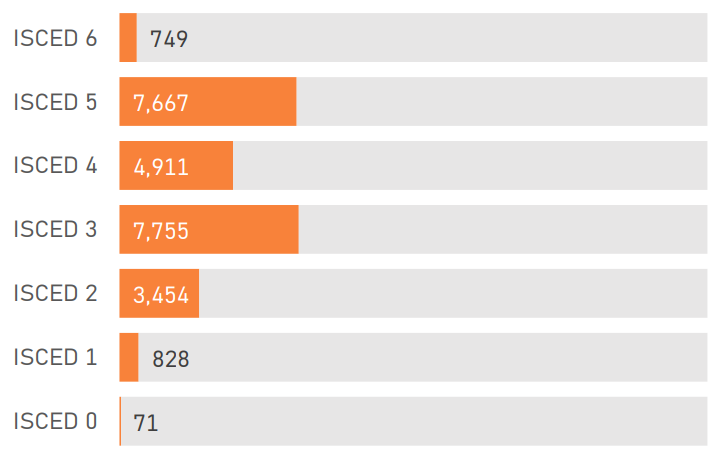
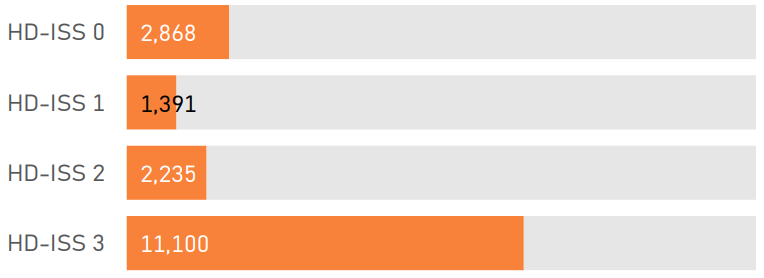
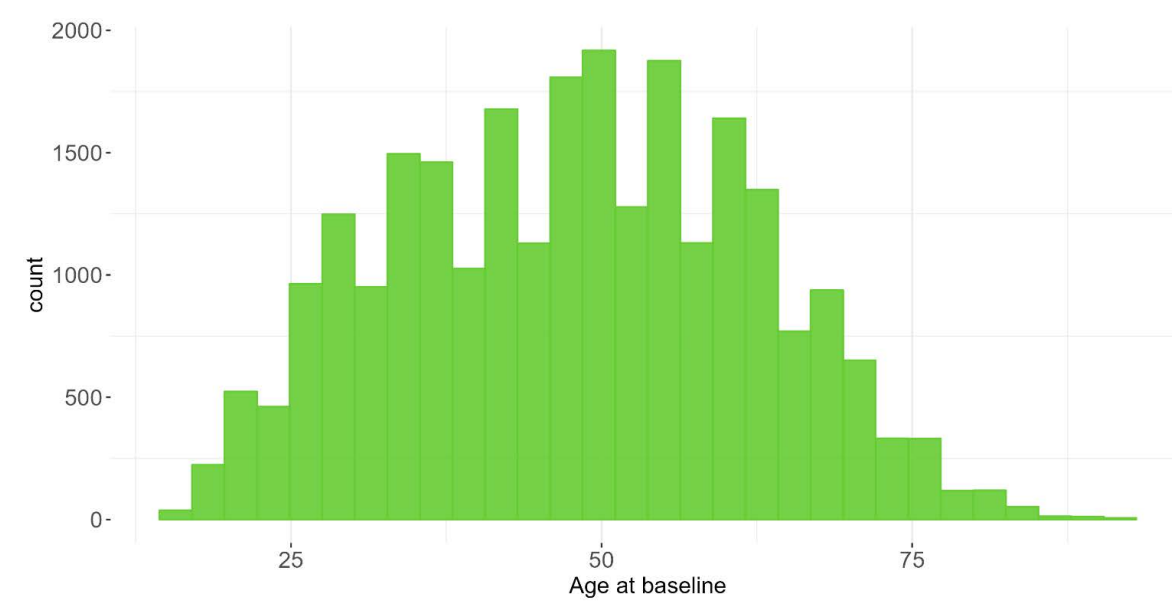
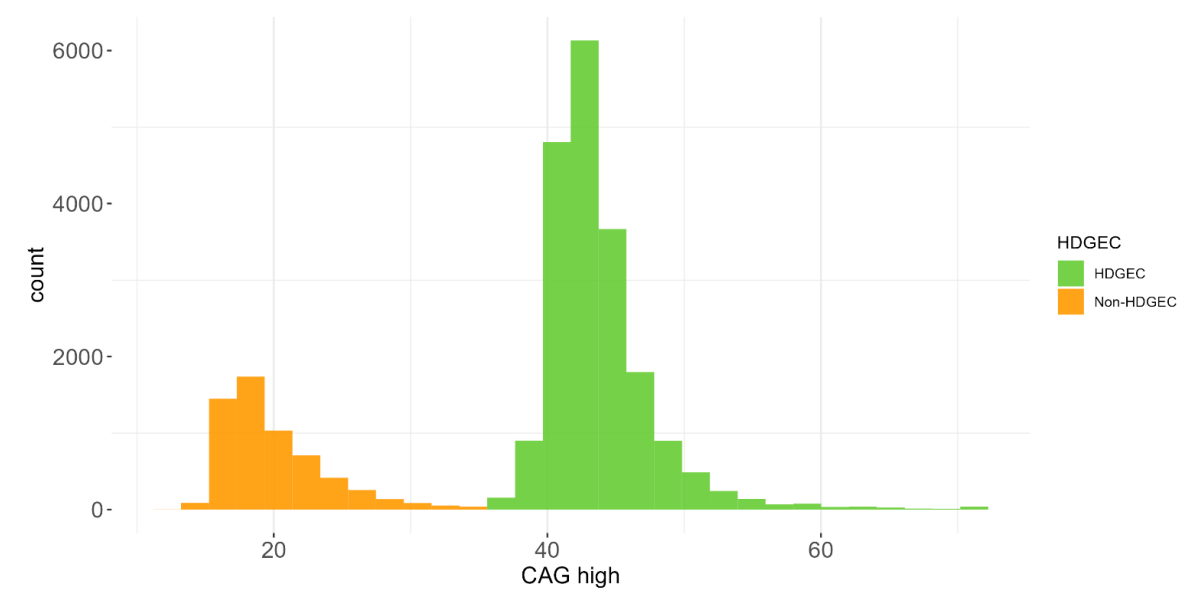
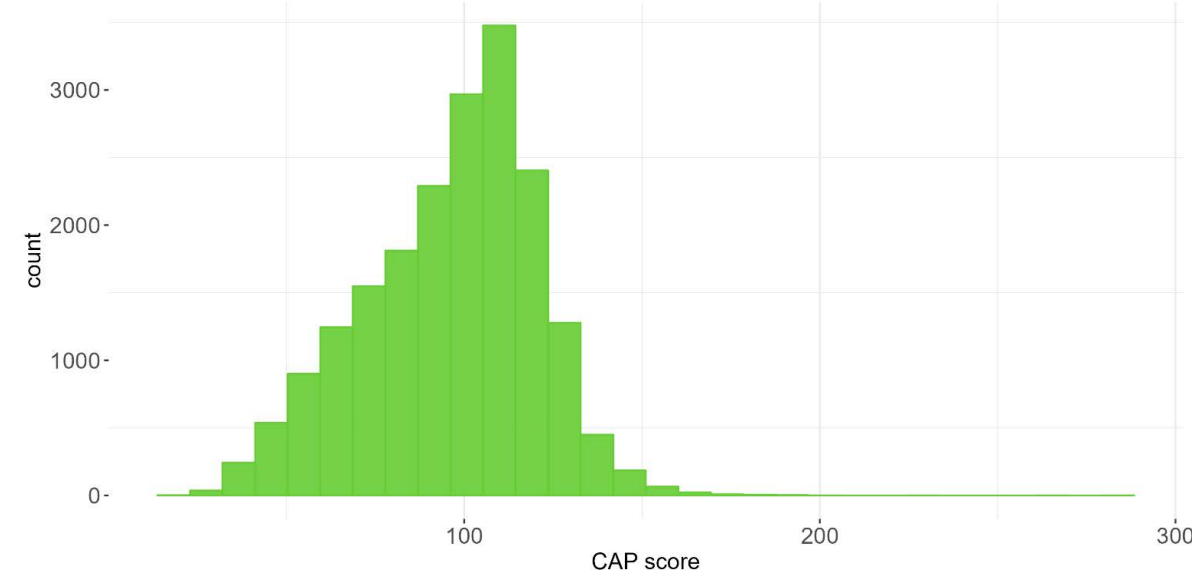
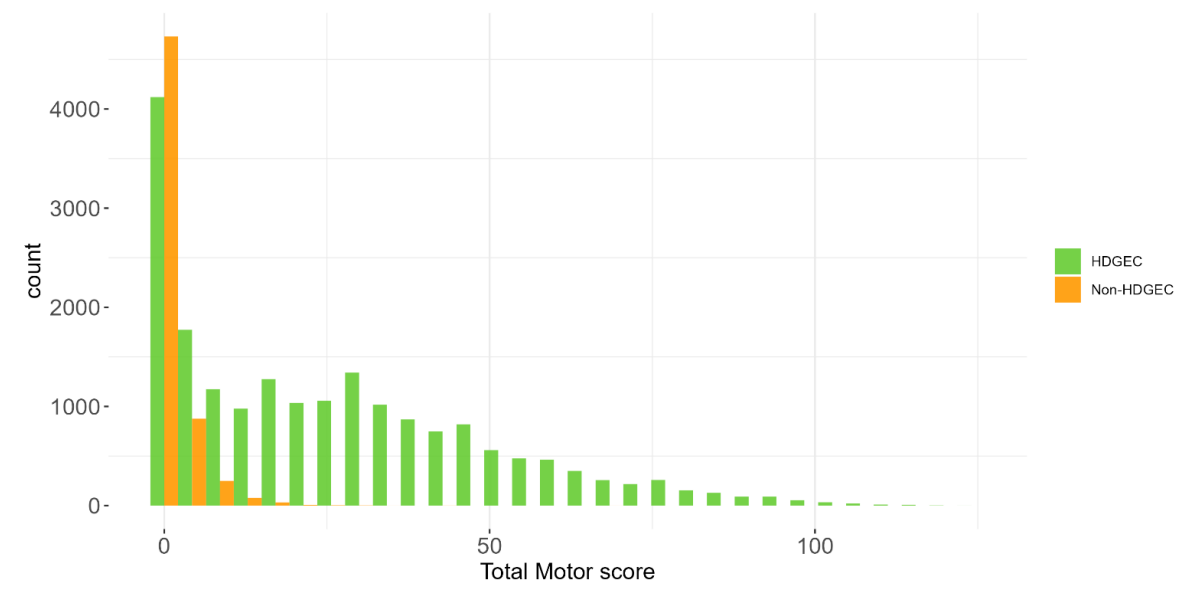
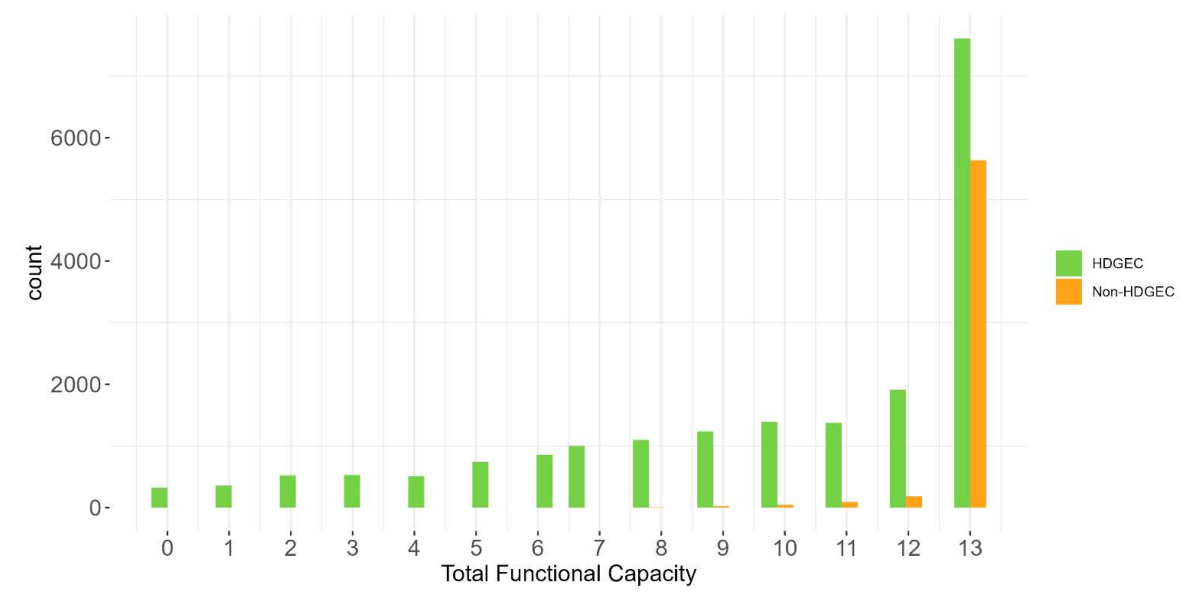
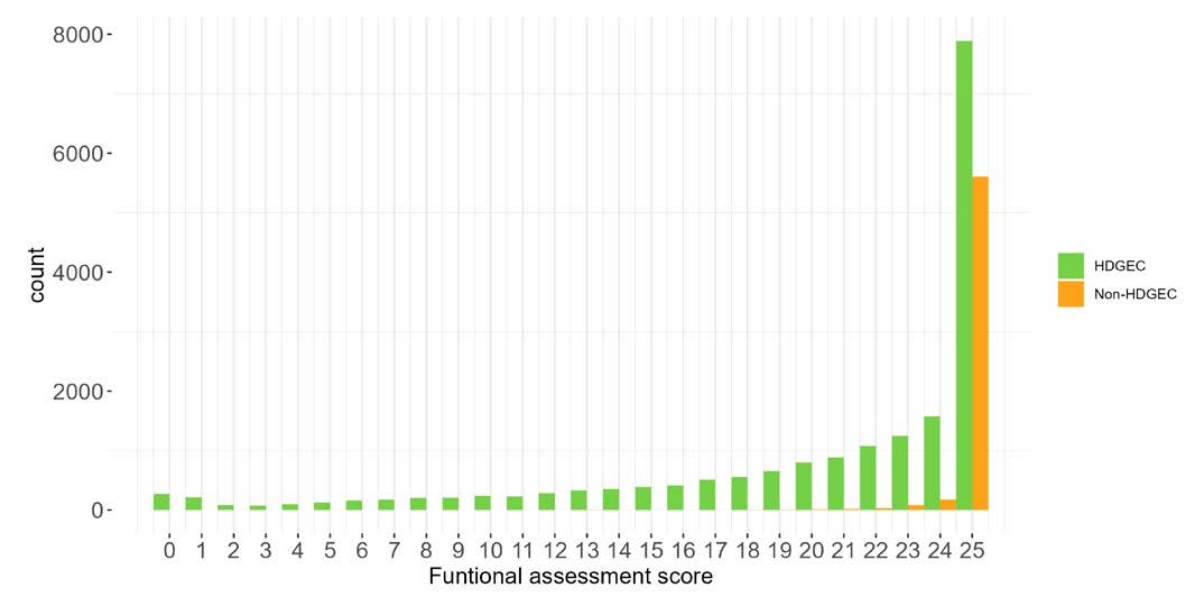
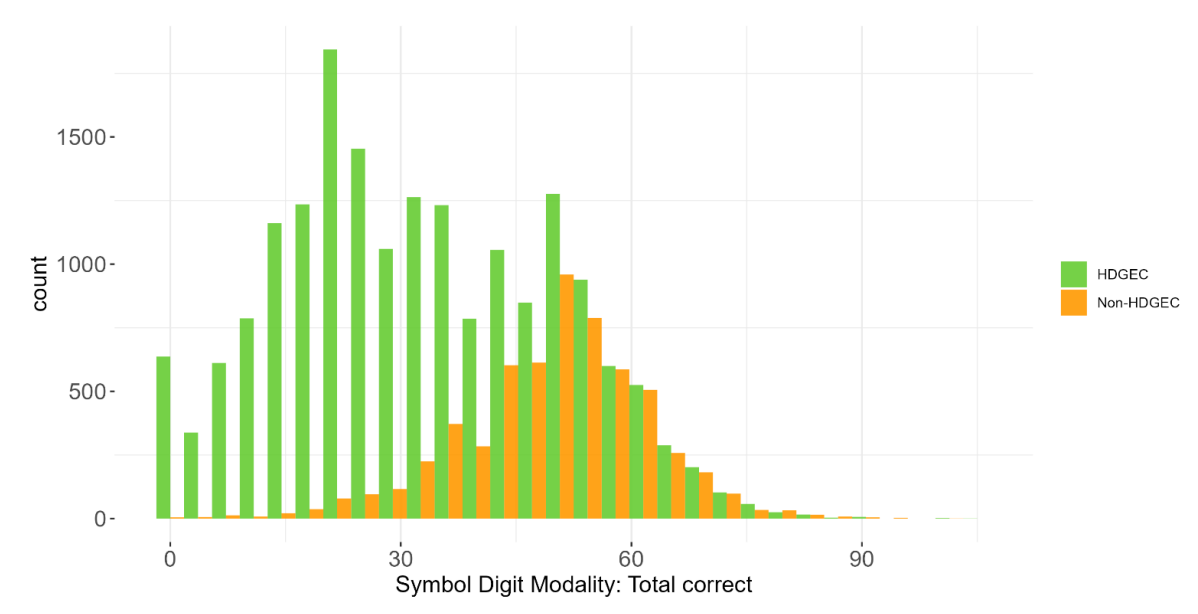
The PDS6 sample is characterized below with respect to participant category, sociodemographic variables, and clinical characteristics (Figures 1.7 to 1.19).


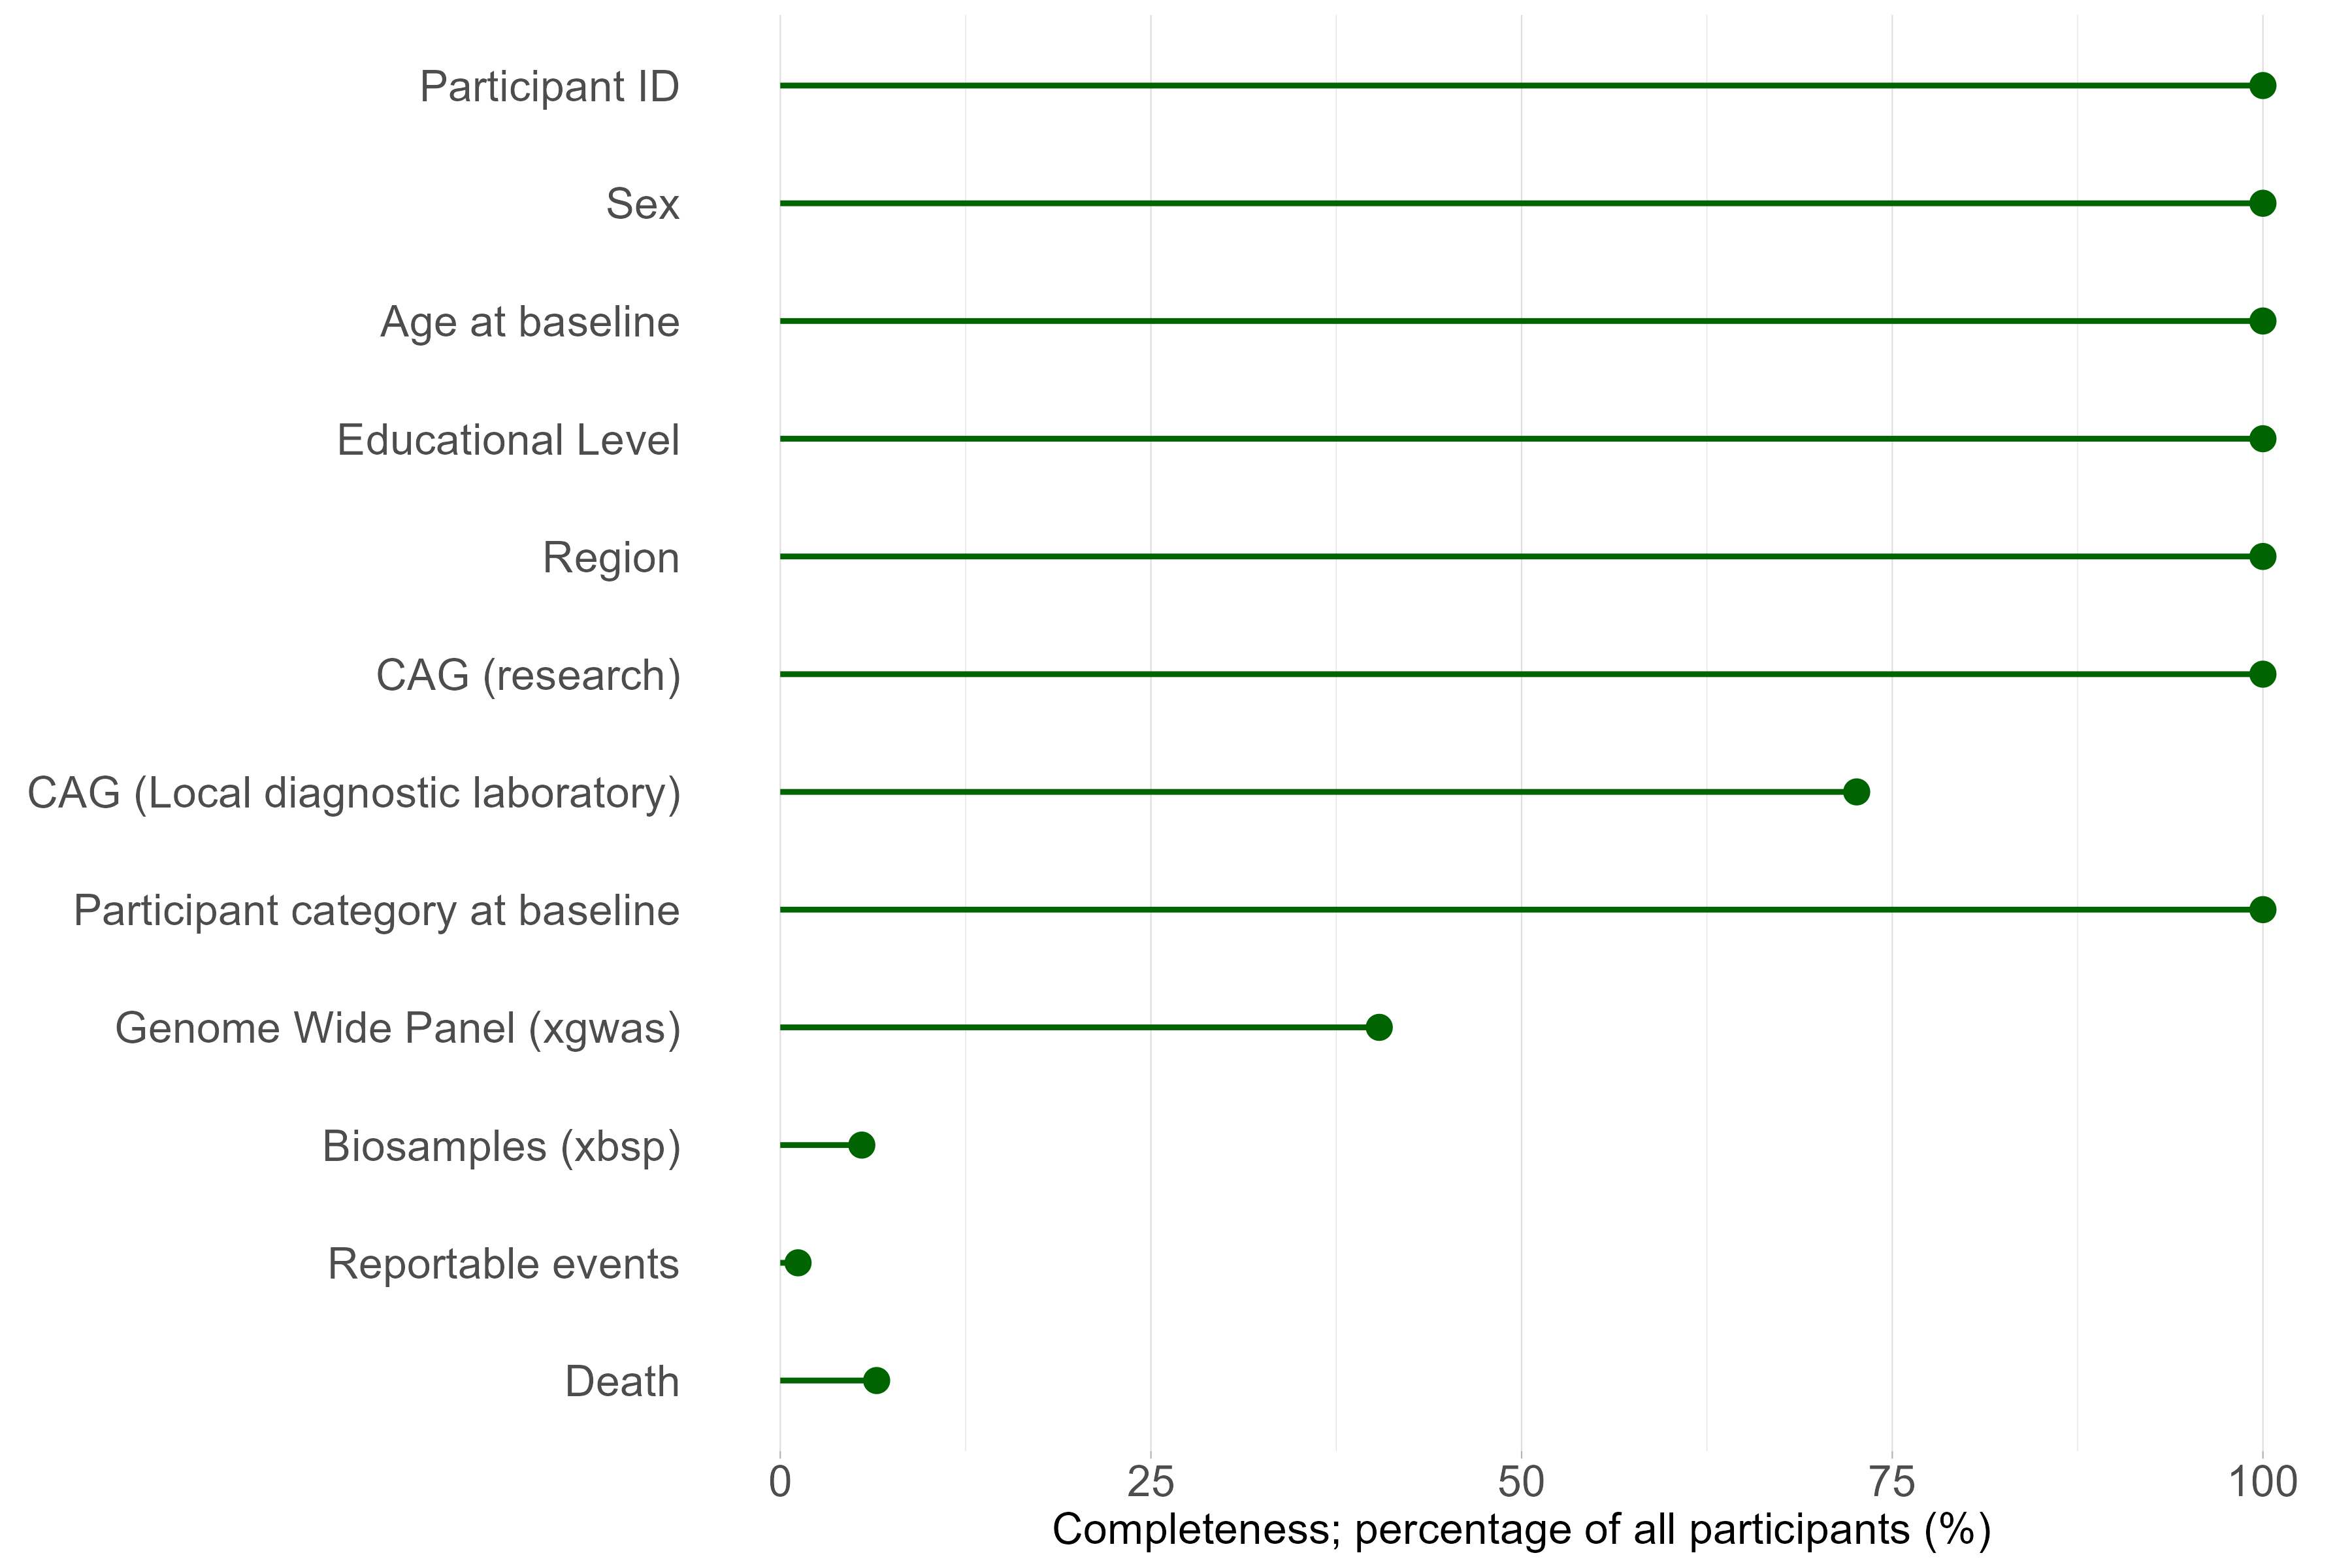
1.5 Data availability and completeness
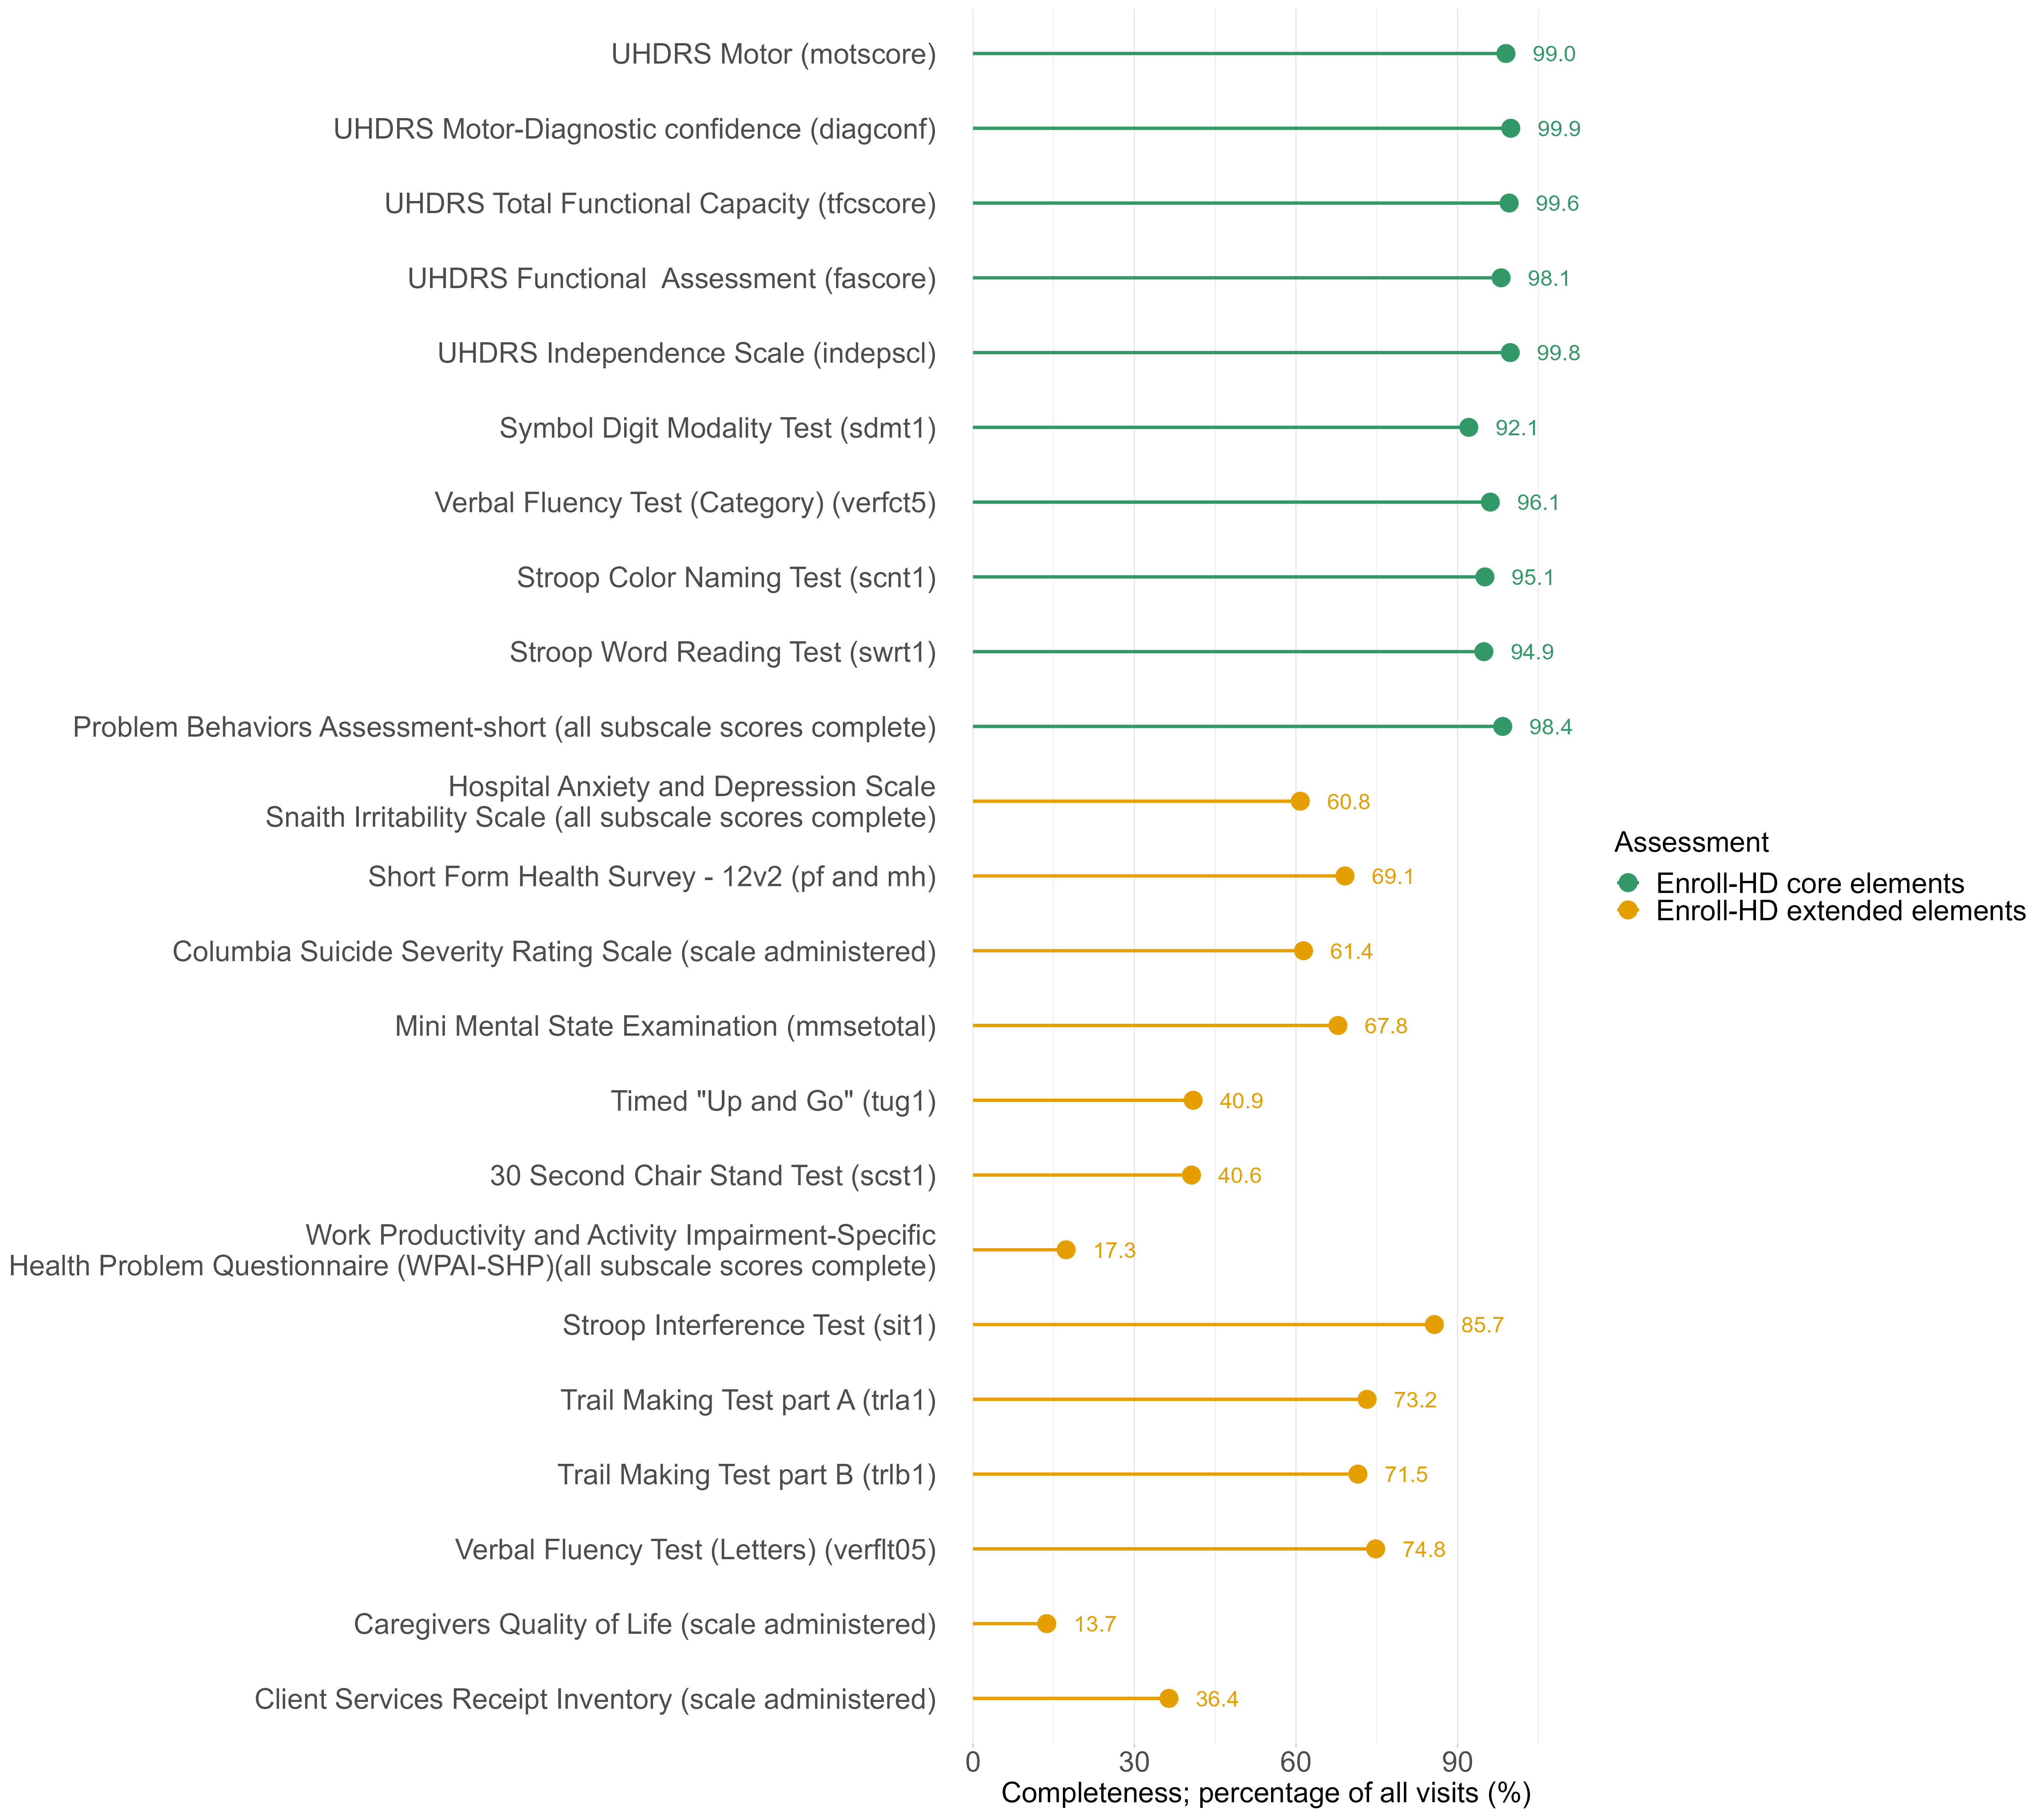
1.6 Coverage data availability by region, participant category, visit count
Coverage charts
Availability of participant data by number of visits, region, and HD participant category, is provided in the coverage charts below (Tables 1.2 to 1.4 ).
| Region | HD Category | Baseline visit | Visit 2 | Visit 3 | Visit 4 | Visit 5 | Visit 6 | Visit 7 | Visit 8 | Visit 9 | Visit 10 |
|---|---|---|---|---|---|---|---|---|---|---|---|
| Australasia | Manifest | 377 | 332 | 256 | 192 | 148 | 100 | 47 | 27 | 9 | 0 |
| Pre-manifest | 292 | 233 | 170 | 127 | 90 | 57 | 27 | 11 | 4 | 0 | |
| Family Control | 95 | 71 | 51 | 36 | 27 | 20 | 9 | 4 | 0 | 0 | |
| Genotype Negative | 96 | 83 | 57 | 41 | 29 | 16 | 9 | 4 | 0 | 0 | |
| Europe | Manifest | 9633 | 7280 | 5381 | 3758 | 2349 | 1289 | 679 | 250 | 21 | 0 |
| Pre-manifest | 3345 | 2339 | 1622 | 1117 | 678 | 368 | 170 | 46 | 5 | 0 | |
| Family Control | 1407 | 978 | 705 | 492 | 285 | 153 | 59 | 9 | 4 | 0 | |
| Genotype Negative | 1655 | 1086 | 740 | 520 | 315 | 184 | 83 | 18 | 0 | 0 | |
| Latin America | Manifest | 237 | 147 | 90 | 45 | 23 | 11 | 6 | 2 | 0 | 0 |
| Pre-manifest | 101 | 57 | 16 | 10 | 5 | 0 | 0 | 0 | 0 | 0 | |
| Family Control | 26 | 13 | 8 | 4 | 1 | 0 | 0 | 0 | 0 | 0 | |
| Genotype Negative | 165 | 95 | 35 | 12 | 8 | 2 | 1 | 0 | 0 | 0 | |
| Northern America | Manifest | 3739 | 2705 | 1973 | 1410 | 947 | 591 | 311 | 144 | 51 | 14 |
| Pre-manifest | 1818 | 1208 | 813 | 563 | 368 | 221 | 123 | 56 | 23 | 6 | |
| Family Control | 1203 | 904 | 701 | 520 | 365 | 241 | 141 | 69 | 40 | 14 | |
| Genotype Negative | 1361 | 871 | 632 | 468 | 350 | 233 | 137 | 69 | 30 | 5 | |
| Total | 25550 | 18402 | 13250 | 9315 | 5988 | 3486 | 1802 | 709 | 187 | 39 |
| Region | HD Category | Baseline visit | Visit 2 | Visit 3 | Visit 4 | Visit 5 | Visit 6 | Visit 7 | Visit 8 | Visit 9 | Visit 10 |
|---|---|---|---|---|---|---|---|---|---|---|---|
| Australasia | Manifest | 45 | 76 | 64 | 44 | 48 | 53 | 20 | 18 | 9 | 0 |
| Pre-manifest | 59 | 63 | 43 | 37 | 33 | 30 | 16 | 7 | 4 | 0 | |
| Family Control | 24 | 20 | 15 | 9 | 7 | 11 | 5 | 4 | 0 | 0 | |
| Genotype Negative | 13 | 26 | 16 | 12 | 13 | 7 | 5 | 4 | 0 | 0 | |
| Europe | Manifest | 2353 | 1899 | 1623 | 1409 | 1060 | 610 | 429 | 229 | 21 | 0 |
| Pre-manifest | 1006 | 717 | 505 | 439 | 310 | 198 | 124 | 41 | 5 | 0 | |
| Family Control | 429 | 273 | 213 | 207 | 132 | 94 | 50 | 5 | 4 | 0 | |
| Genotype Negative | 569 | 346 | 220 | 205 | 131 | 101 | 65 | 18 | 0 | 0 | |
| Latin America | Manifest | 90 | 57 | 45 | 22 | 12 | 5 | 4 | 2 | 0 | 0 |
| Pre-manifest | 44 | 41 | 6 | 5 | 5 | 0 | 0 | 0 | 0 | 0 | |
| Family Control | 13 | 5 | 4 | 3 | 1 | 0 | 0 | 0 | 0 | 0 | |
| Genotype Negative | 70 | 60 | 23 | 4 | 6 | 1 | 1 | 0 | 0 | 0 | |
| Northern America | Manifest | 1034 | 732 | 563 | 463 | 356 | 280 | 167 | 93 | 37 | 14 |
| Pre-manifest | 610 | 395 | 250 | 195 | 147 | 98 | 67 | 33 | 17 | 6 | |
| Family Control | 299 | 203 | 181 | 155 | 124 | 100 | 72 | 29 | 26 | 14 | |
| Genotype Negative | 490 | 239 | 164 | 118 | 117 | 96 | 68 | 39 | 25 | 5 | |
| Total | 7148 | 5152 | 3935 | 3327 | 2502 | 1684 | 1093 | 522 | 148 | 39 |
| Region | HD Category | Baseline visit | Visit 2 | Visit 3 | Visit 4 | Visit 5 | Visit 6 | Visit 7 | Visit 8 | Visit 9 | Visit 10 |
|---|---|---|---|---|---|---|---|---|---|---|---|
| Australasia | Manifest | 45 | 73 | 55 | 39 | 43 | 38 | 18 | 14 | 9 | 0 |
| Pre-manifest | 59 | 66 | 52 | 42 | 38 | 45 | 18 | 11 | 4 | 0 | |
| Family Control | 24 | 20 | 15 | 9 | 7 | 11 | 5 | 4 | 0 | 0 | |
| Genotype Negative | 13 | 26 | 16 | 12 | 13 | 7 | 5 | 4 | 0 | 0 | |
| Europe | Manifest | 2352 | 1835 | 1518 | 1300 | 933 | 524 | 362 | 189 | 19 | 0 |
| Pre-manifest | 1007 | 781 | 610 | 548 | 437 | 284 | 191 | 81 | 7 | 0 | |
| Family Control | 429 | 273 | 213 | 207 | 132 | 94 | 50 | 5 | 4 | 0 | |
| Genotype Negative | 569 | 346 | 220 | 205 | 131 | 101 | 65 | 18 | 0 | 0 | |
| Latin America | Pre-manifest | 44 | 40 | 8 | 6 | 6 | 0 | 0 | 0 | 0 | 0 |
| Manifest | 90 | 58 | 43 | 21 | 11 | 5 | 4 | 2 | 0 | 0 | |
| Family Control | 13 | 5 | 4 | 3 | 1 | 0 | 0 | 0 | 0 | 0 | |
| Genotype Negative | 70 | 60 | 23 | 4 | 6 | 1 | 1 | 0 | 0 | 0 | |
| Northern America | Pre-manifest | 611 | 441 | 288 | 276 | 197 | 144 | 97 | 69 | 32 | 11 |
| Manifest | 1033 | 686 | 525 | 382 | 306 | 234 | 137 | 57 | 22 | 9 | |
| Family Control | 299 | 203 | 181 | 155 | 124 | 100 | 72 | 29 | 26 | 14 | |
| Genotype Negative | 490 | 239 | 164 | 118 | 117 | 96 | 68 | 39 | 25 | 5 | |
| Total | 7148 | 5152 | 3935 | 3327 | 2502 | 1684 | 1093 | 522 | 148 | 39 |
Geographical coverage
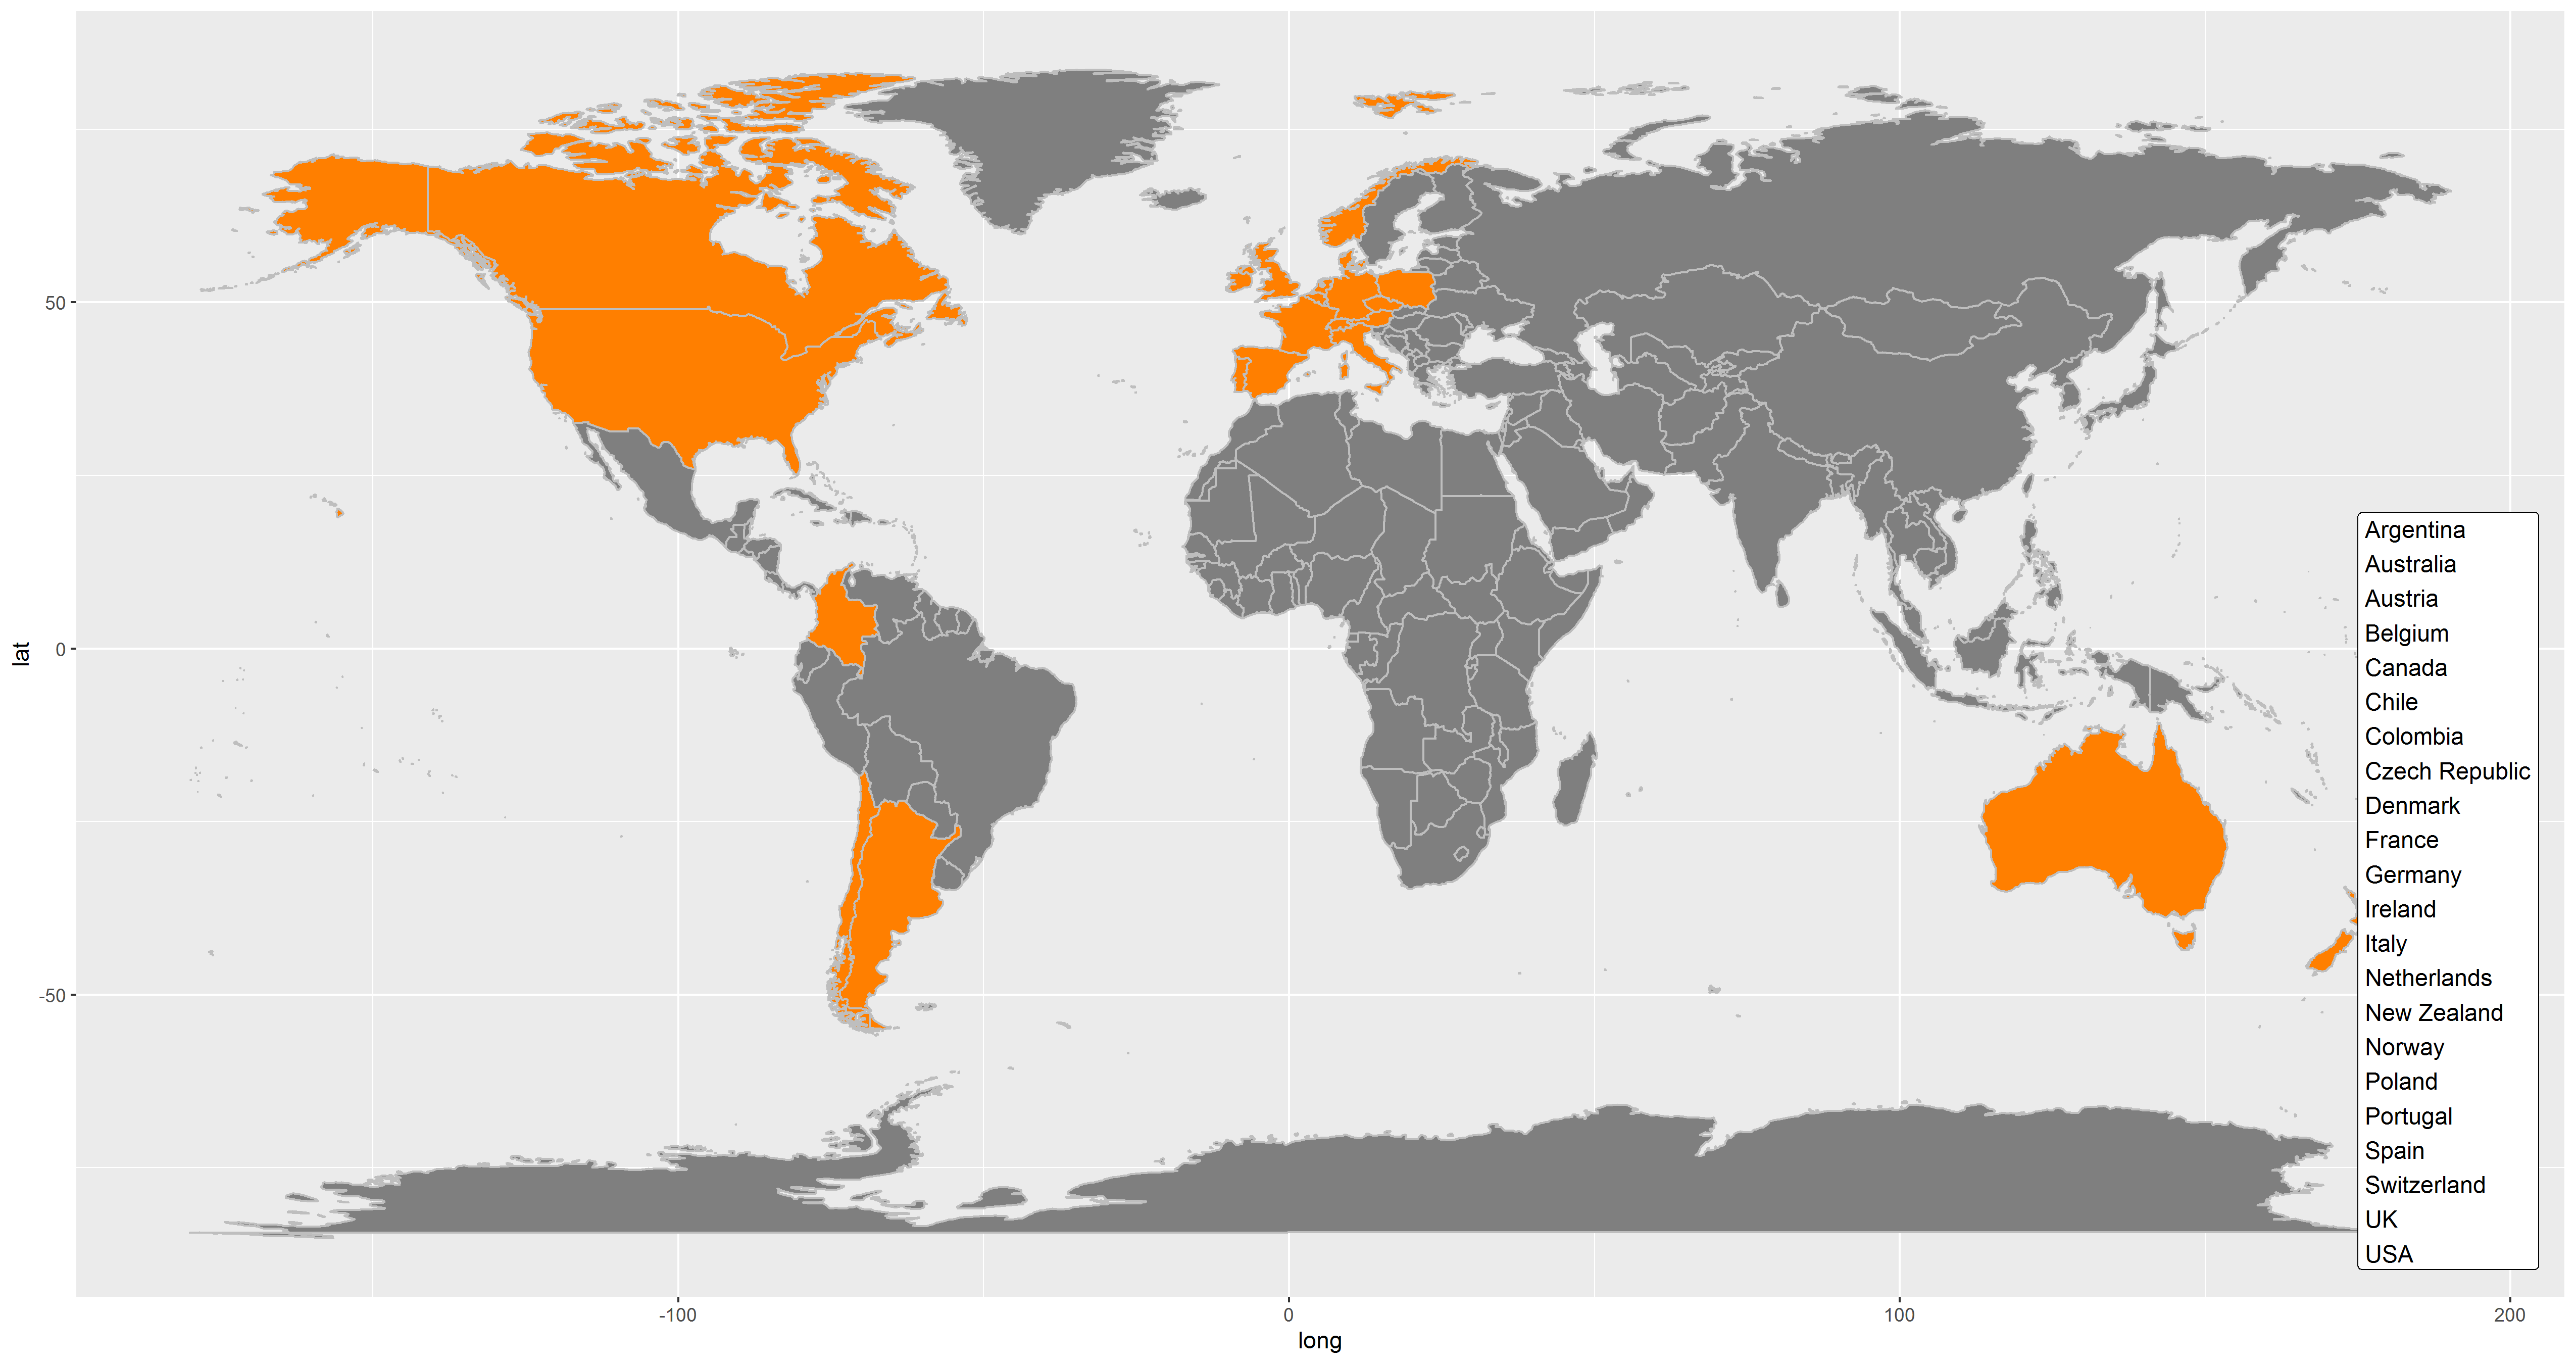
Enroll-HD PDS6 data were collected from 179 clinical sites located across 22 countries (Figure 1.22)
1.7 Revision History
PDS6 overview R1 > PDS6 overview R2:
Text, tables, and plots updated to reflect changes implemented for PDS6 R2. Note that visits were removed for two family control participants. For further information on PDS changes, please refer to the Change Log .