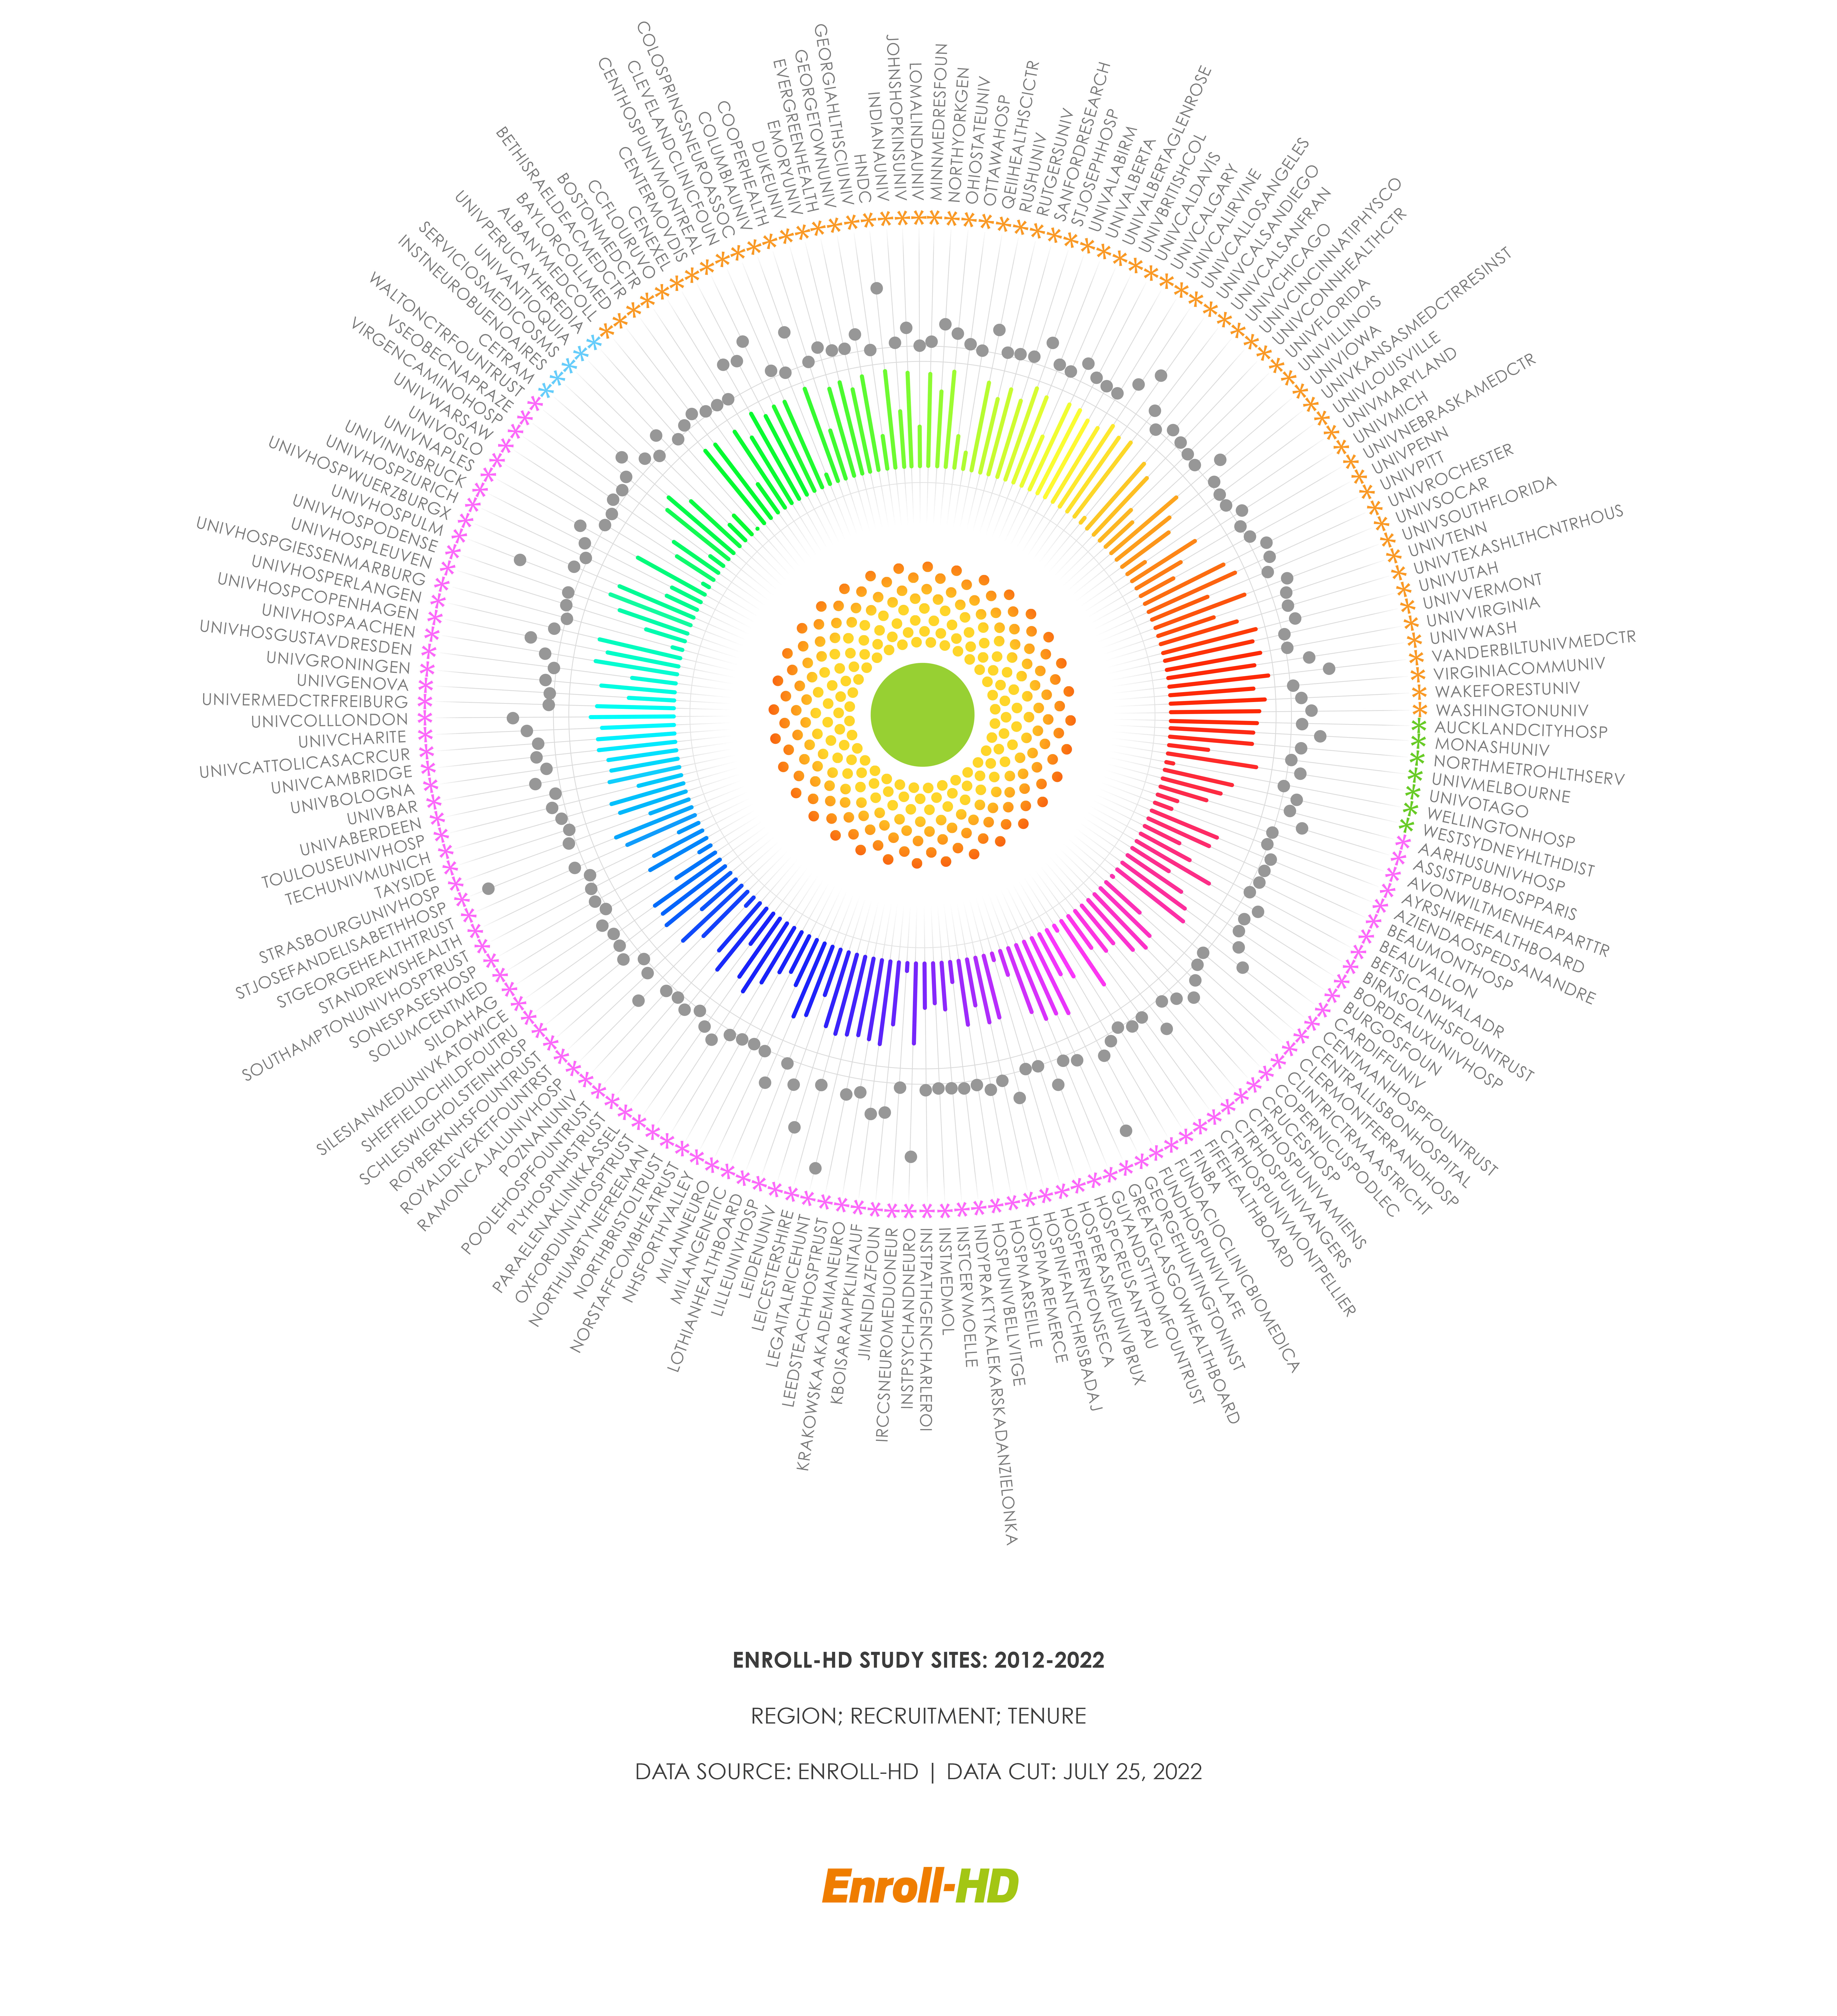
Enroll-HD study sites: 2012-2022 | Region; recruitment, tenure
July 26, 2023
Last year, Enroll-HD celebrated the 10-year anniversary of the very first participant entering the study. To celebrate this important milestone and the achievements that the community has made over the last decade, a series of events and celebrations have been held.
The Enroll-HD anniversary data visualization – “Enroll-HD study sites: 2012-2022 | Region; recruitment, tenure” – was designed to recognize and acknowledge the efforts of the staff at 183 study sites who have contributed to Enroll-HD during its first 10 years.
The radial design depicts individual Enroll-HD study sites, each listed around the periphery of the image, and three metrics associated with each. Geographical region is illustrated around the circumference by a color-coded star (purple=Europe; yellow=North America; green=Australasia; blue=Latin America). Total recruitment (current as of July 25, 2022) is represented by a filled grey circle, positioned on a radial axis with larger numbers displayed towards the edge of the image (scale range = 1 to 1030). Finally, the tenure of each site – bound by the first time a participant was seen at that site and last/most recent visit – is illustrated by the length of the central rainbow-colored bar (scale range = 0 to 10 years). The Enroll-HD logo is positioned in the center of the image. This visualization was printed on glass and delivered to each site as a token of appreciation for all their work.

